Introduction
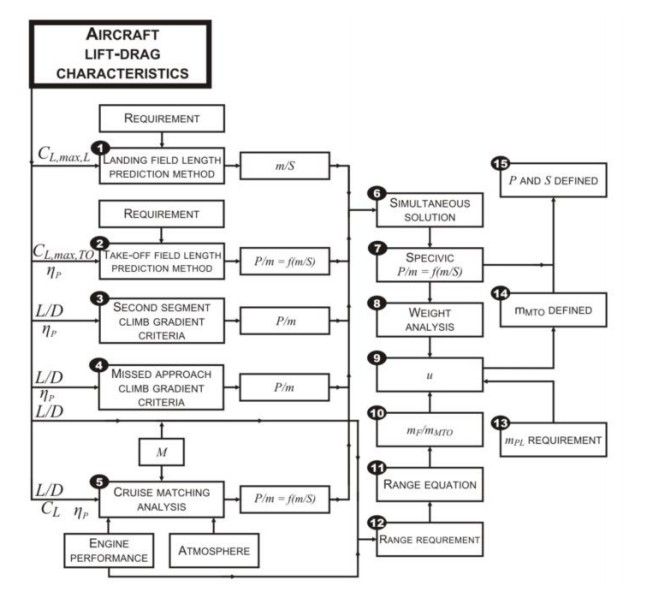
This article introduces the first step in the preliminary sizing process, which is to determine the so-called aircraft design point in terms of wing loading and thrust-to-weight ratio. The requirements, constraints imposed by market, passengers, payload, weight are the factors to take in to account for the preliminary sizing of an aircraft. At the end of this process a design point is defined in a matching chart. It returns the values which meet all the requirements in the best economical manner. After the preliminary sizing there is the optimization by means is achieving the highest possible wing loading and the smallest possible power to weight ratio. The following five requirements posed to an aircraft for its certification according to the American and/or European certification regulations lead to the design point:
– Landing distance
– Take-off distance
– Take-off climb gradient
– Missed approach climb gradient
– Cruise Mach number
Each requirement delivers a value for either wing loading, thrust-to-weight ratio or a relation of the two, and all values are plotted into one matching chart to define the aircraft design point (see in the end of this article). The first priority when choosing the design point is to minimize the thrust-to-weight ratio to be able to select or develop the smallest and consequently cheapest possible engines. The second priority is to maximize the wing loading which leads among other things to a smaller and principally lighter and cheaper wing. Below is shown an overview of the preliminary size method for propeller driven aeroplanes.
1) Landing distance
The landing distance is calculated taking in to account the the equation lift = maximum landing weigh and it provides a maximum value for the wing loading :
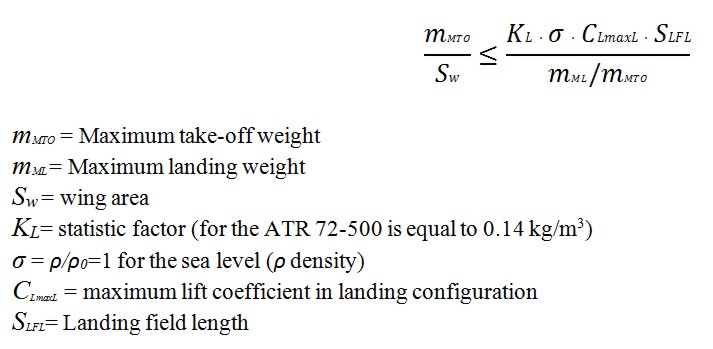
For the lift coefficient the value must be chosen from empirical data or statistics. Statistics show that the lift coefficient lies between 1.6-2.5. The value of the maximum landing mass over maximum take-off mass comes also from statistics; generally the values lies between 0.9 and 1. Inserting in this equation the parameters, the wing loading (must not be exceeded if the aircraft has to meet the requirements. Once this equation is sotisfied, thus having as input data the landing field length, we can also obtain the approach speed and the minimum landing speed:
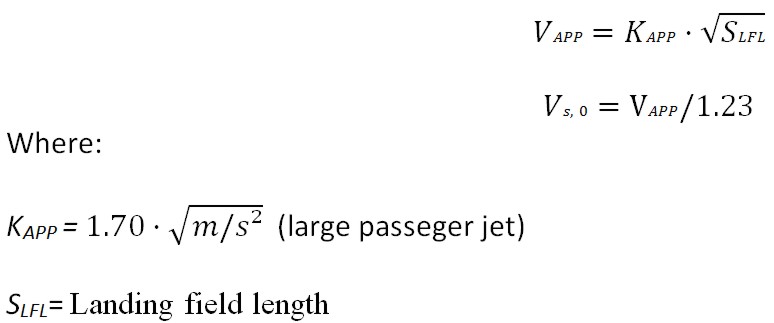
This equation comes from a preliminary sizing method proposed by Laurence K. Loftin. The is divided by 1.23 for the landing requirements (JAR-25.125).
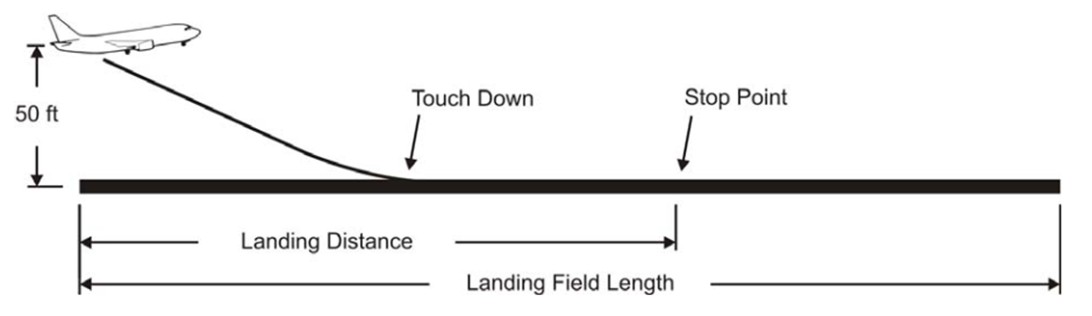 Figure 1: Definition of the landing field length according to CS 25 and FAR
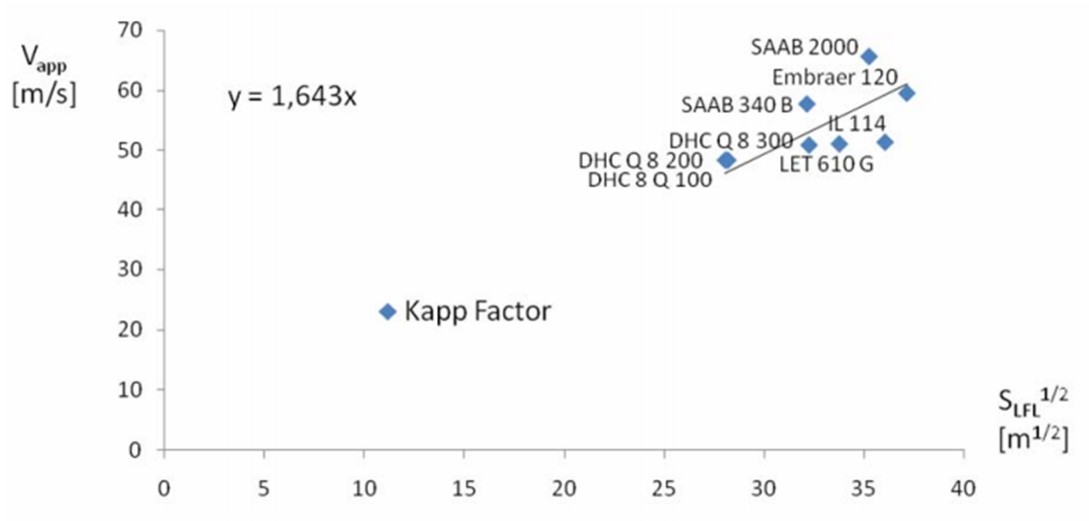 Figure 2: Statistical factor KAPP for approach speed calculation from landing field length
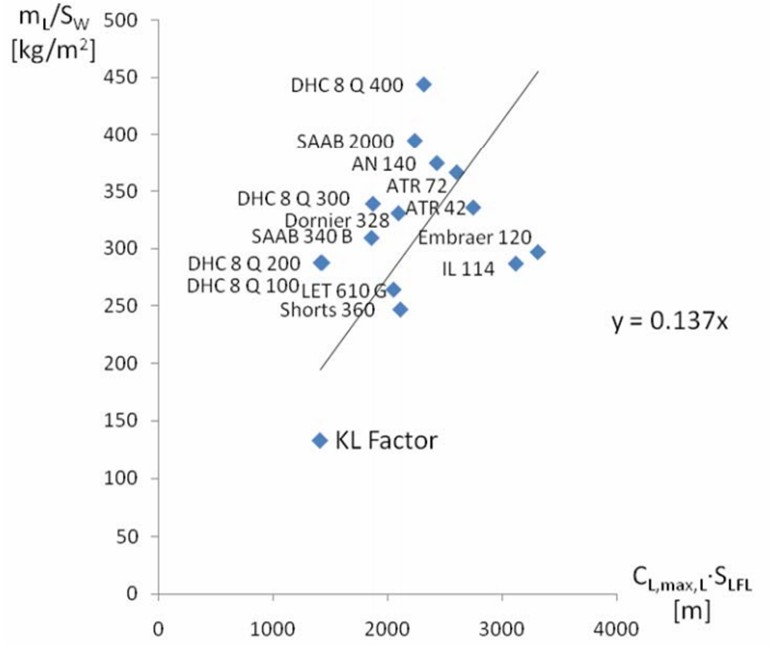 Figure 3: Statistical factor KL for calculating wing loading from landing field length and maximum lift coefficent upon landing for turboprop aircraft.
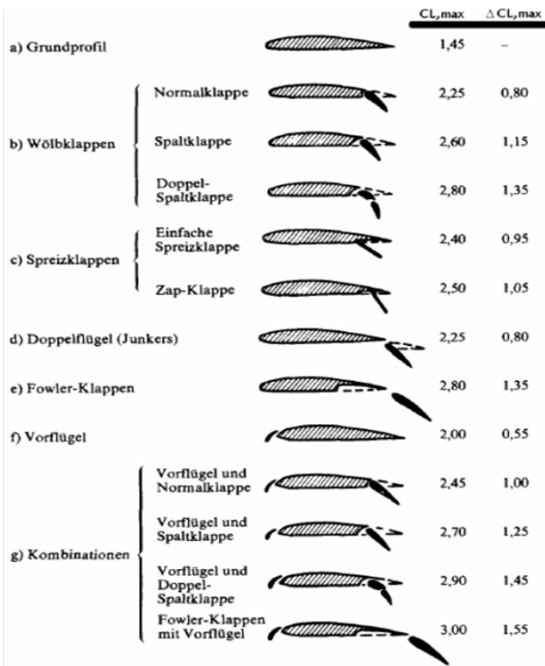
Figure 4: Maximum lift coefficients of different high-lift devices
2) Take-off Distance
The Take-off distance provides a minimum value for the power-to-mass ratio as function of the wing loading:
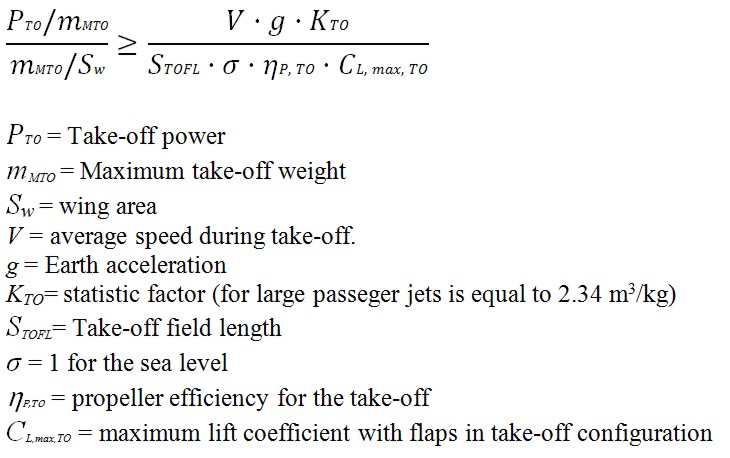
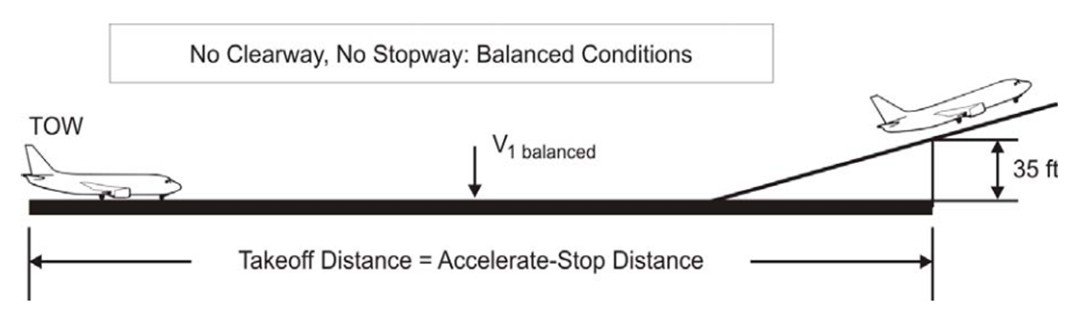 Figure 5: Balanced field length according to CS and FAR
This formula is valid for the turboprop, you can get the general formula by introducing the thrust, that it is equal to (ηP,TO · PTO)/V, thus this equation can be writen:
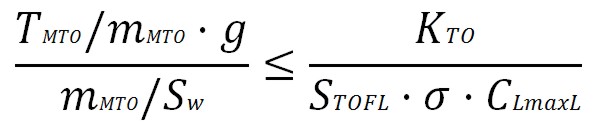
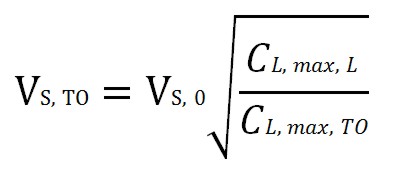
The lift coefficient is obtained in take-off configuration and it can be chosen from the literature or from similar aircrafts data. For the take-off, the lift coefficient can be approximated with the formula: CL,max,TO ≈ 0.8 · CLmaxL. The average speed is calculated with respect to dynamic pressure between the initial configuration and the required configuration in take-off:
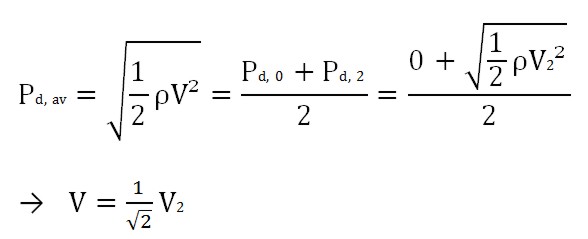
The V2 is the take-off safety speed that has to be reached at the end of the take-off distance, and it is equal to as per CS-25:
V2= 1.13 VS,TO
The take-off stall speed depends on flap setting and hence it is lenked to the selected lift coefficent:
The Take-off distance AEO (all engines operating) is 115% of the distance required to fly over an obstacle of 35ft according to CS 25.113 aviation regulation.
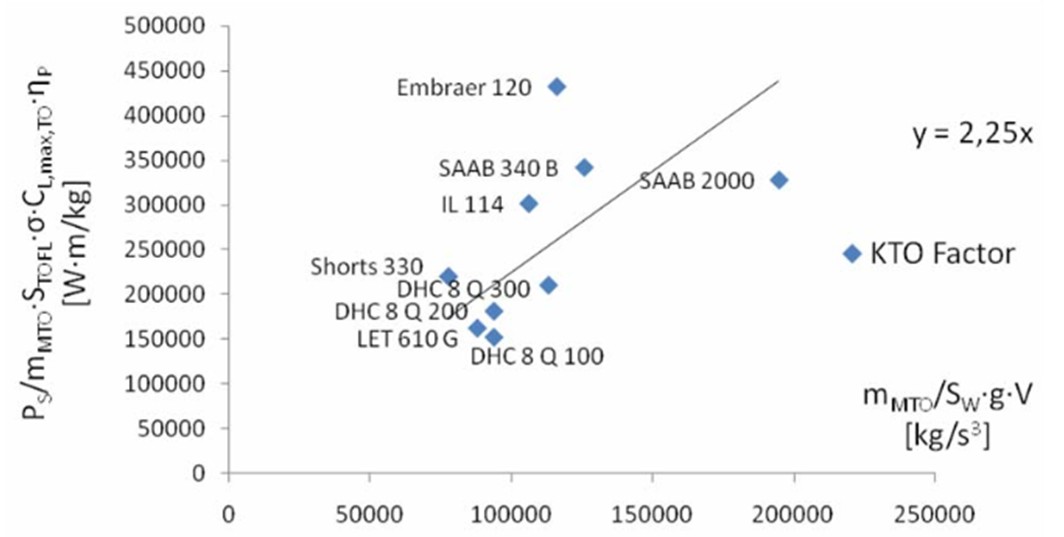 Figure 6: Statistical factor KTO for calculationg the take-off optimization parameter from take-off field length and maximum lift coefficent upon take-off
The propeller efficency ηP,TO for the turboprops depends of the average speed and disc loading (L=PTO/σ·ρo·SD, SD disc area ), see the figure below.
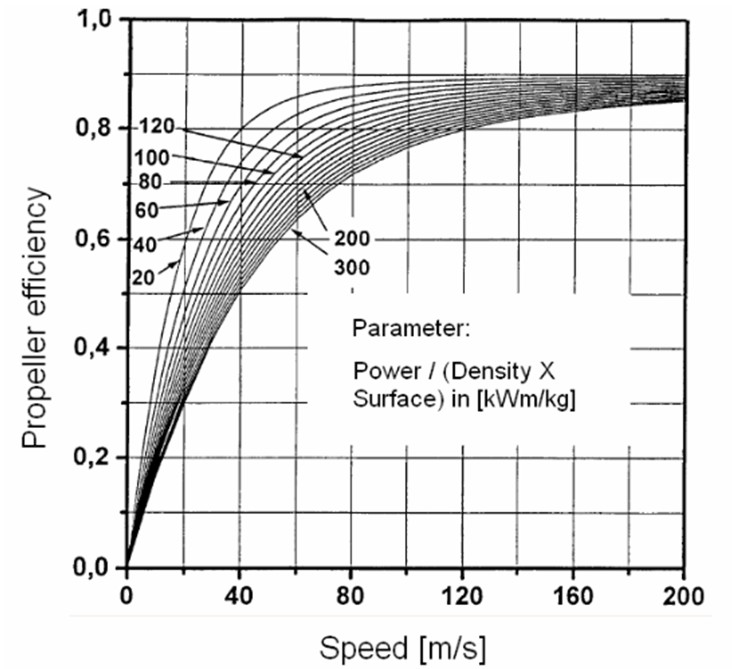
Figure 7: Propeller Efficiency Diagram
During the first iteration of the sizing procedure the take-off power is unknown, instead the propeller efficency is estimated from this graphic. In the second iteration the take-off power is used to get a better estimation by the figure #.
3) Climb Rate during 2nd Segment
There is a point of take-off path at which the landing gear is fully retracted. The climb path is shown in the figure below:
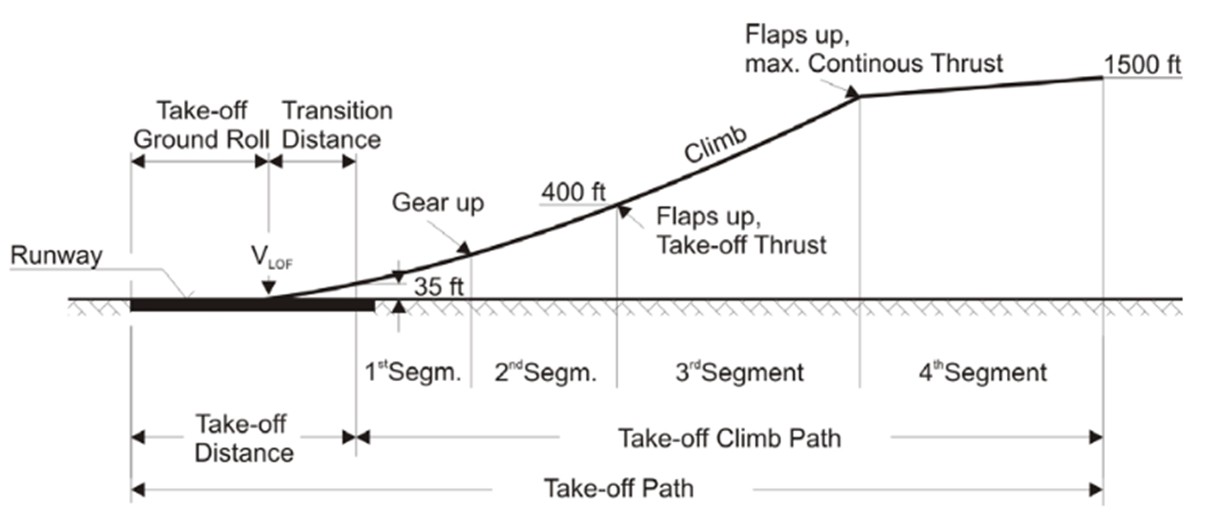
Figure 8: Take-off and Climb path
The steady gradient of climb is between 2 % – 4 % in the second segment (the slope must be positive in every point).
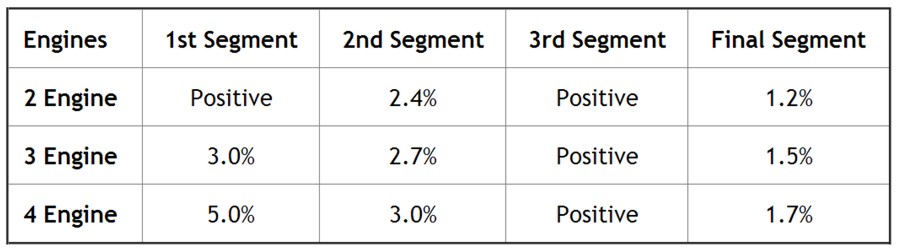 Table 1 : Climb gradient for different engines configuration
In the climb phase the thrust T must be bigger to the drag and also a fraction of the weight, due to climb angle φ:
T = D + m·g·sinφ (1)
The Lift must balance the vertical fraction of the weight:
L = m·g·cosφ≈ m·g (2)
Dividing by m·g the equation (1) becomes:
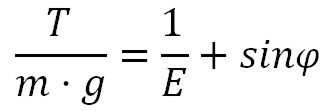
Taking in to account the number of engines the thrust to weight ratio must be grater:
![]()
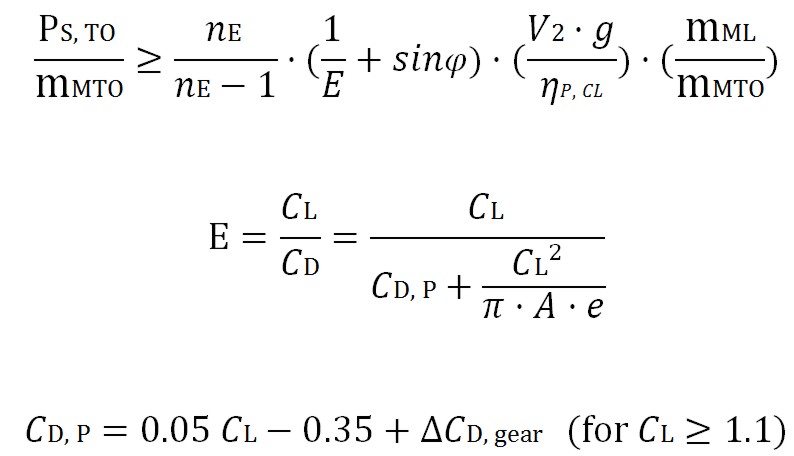
Since TTO= (PS,TO· )/V2 this equation can be written:
![]()
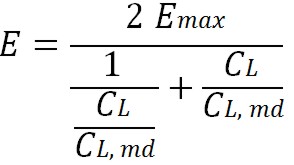
E=L/D is the glide ratio during the take-off (with extended landing gear and flaps) estimated from wing aspect ratio A, Oswald efficiency factor e:
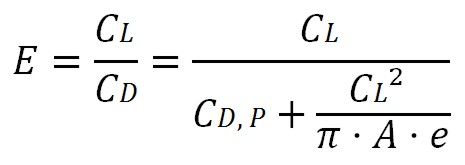
The CD is the sum of profile drag and induced drag. The wing aspect ratio is defined as the square of the wingspan b divided by the area S of the wing planform. The Oswald efficiency is a correction factor that represents the change in drag with lift of a three-dimensional wing or airplane, as compared with an ideal wing having the same aspect ratio and an elliptical lift distribution (generally is equal to 0.7 for passenger aircraft). Considering the influence of lift system and landing gear, the CD,P is equal to:
![]()
In the second segment the landing gear comes up, so it is equal to zero (for CS 25, for FAR part 25 is 0.015-0.020), and the ΔCD,SLAT is neglectable, for the CD,0 a value of 0.02 is applied for normal passeger aircraft. The ΔCD,flap is equal to 0.05CL-0.055 and CL:
![]()
4) Climb Rate during Missed Approach
During the final approach for landing, if for some reason a decision is taken not to land, a thrust has to be applied and the aircraft has to climb in order to start a new approach, according to a predefined procedure. This procedure occurs in the landing configuration, with landing gear extracted and the flaps in the landing position, in order to create a higher drag (as per CS25.121:”The steady gradient of climb may not be less than 2% for two-engined aeroplanes, 2.4% for three-engined aeroplanes, 2.7% for four-engined aeroplanes). The formulas used are similar to the ones used for the 2nd segment, but since the aircraft is in landing configuration, the weight of the airplane is different:
Note the propeller efficiency calculation requires iteration.
5) Cruise
Cruise calculation is performed considering a stationary straight flight at cruise altitude. For the requirment of the cruise speed or Mach number the power to mass ratio and wing loading are determinated. To reach this scope two equilibrium equations are used: Lift=Weight and Drag=Thrust. Since the cruise altitude is not determinated in the beginng of the sizing, the power to mass and the wing loading are calculated for a range of possible cruise altutude.
5-1) Power to Weight Ratio
The thrust to weight ratio in the cruise fase is equal to the drag, and according the theory:
![]()
Dividing this formula by the take-off thrust an considering the propeller as driven factor:
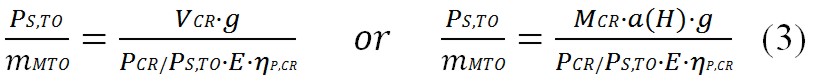
MCR is the mach number, a(H) is the sound velocity and it depends of the altitude H. To calculate the power to weight ratio during cruise flight we have to approximate the termsPCR/PS,TO, E=L/D.
5-2) Estimation of Lift to Drag Ratio During Cruise
The lift to drag ratio depends mainly on the wing aspect ratio and the wing area. The glide ratio (E) is numerically equal to the Lift-to-drag ratio. The glide ratio is the ratio of the distance forwards to downwards (see the figure below).
![]()
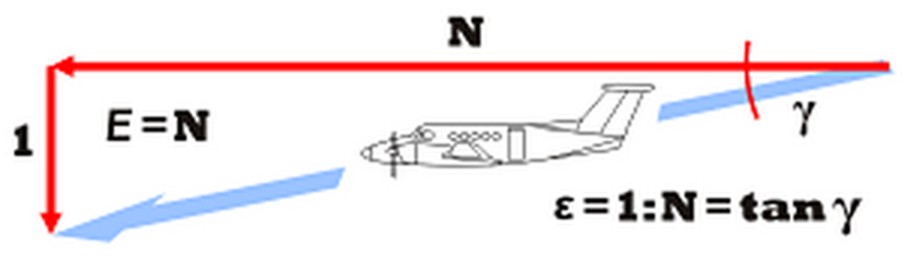
Figure 9: Glide ratio angle
It is not necessarily equal during other manoeuvres, especially if speed is not constant. A glider’s glide ratio varies with airspeed, but there is a maximum value which is frequently quoted. Glide ratio usually varies little with vehicle loading however, a heavier vehicle glides faster, but maintains its glide ratio. In the table below are reported several values. This parameter is really important for the controlling of the flight. Experiments with lifting bodies show that a lift/drag ratio below about 2 makes landing very difficult because of the high rate of descent.
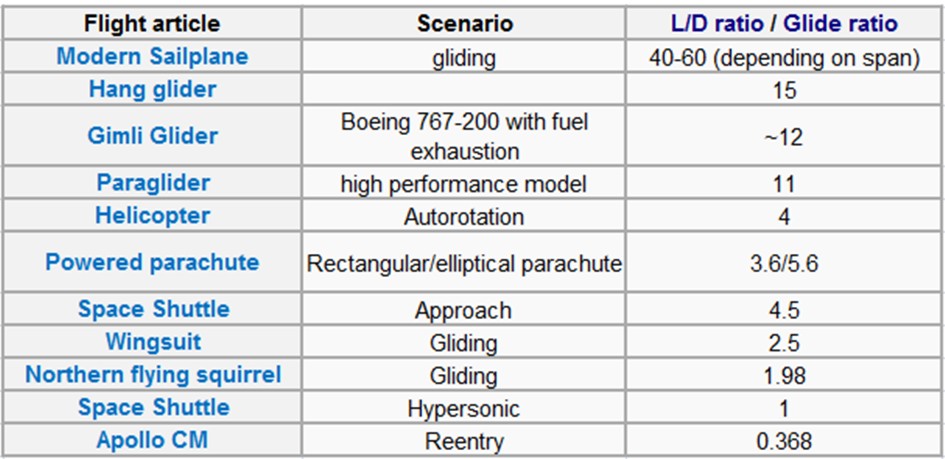
Table 2: Typical Glide radio
According the theory:
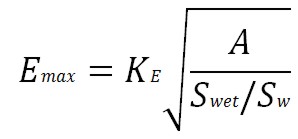
A: aspect ratio
Swet: wet area
Sw: wing area
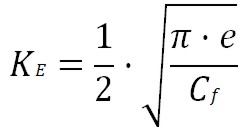
The value KE can be approximated, the literature (Raymer , Torenbeek) gives us some approximate values for this factor. It can be calculated with this formula:
The graph bellow shows this influence for different types of aircrafts.
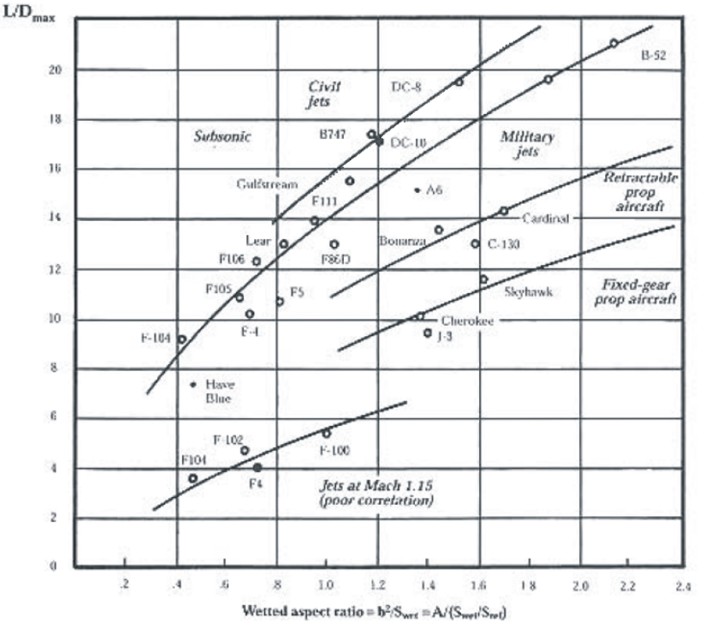
Figure 10: Estimation of glide ratio, wetted area and wing area
This diagram shows the right ratio Swet/Sw for different aircraft categories (Raymer 2006).
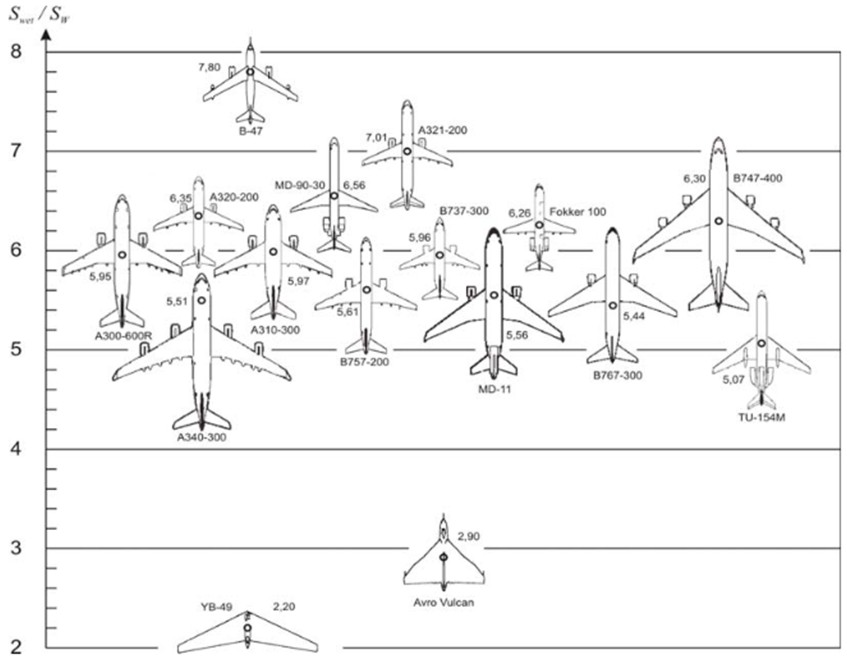
Figure 11: Aircraft plan forms and their relative wetted area S wet /Sw.
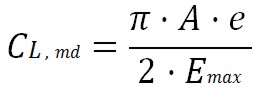
The lift coefficient during cruise, when the drag is minimum, can be obtained by derivation E to CL and by making this relation equal to zero and the result is:
We can obtain a relation between actual lift coefficient to minimum drag coefficient and velocity for minimum drag flight:
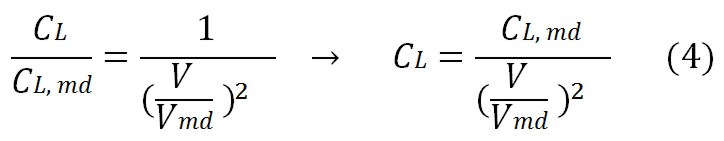
In this way the actual lift to drag ratio can be approximate, during cruise, depending on Emax:
For propeller driven aircrafts the value of V/Vmd is proven to be ≈ 1. Another possible estimation for L/D comes from statistics, see the figure below.
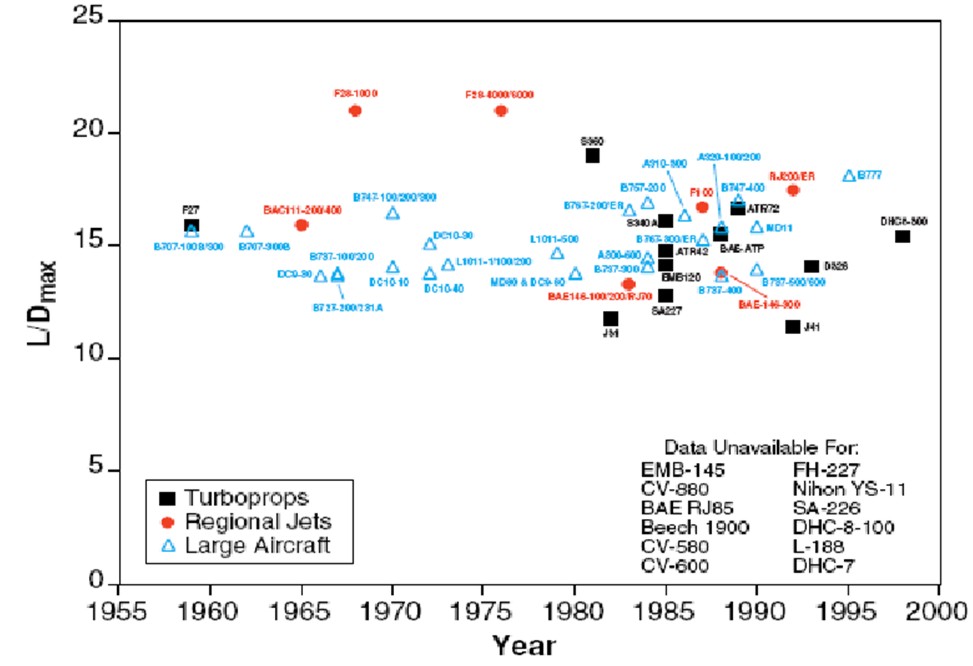
Figure 12: Aerodynamic data for commercial aircraft: L/D for cruise (Babikian 2001)
5-3) Estimation of Power Variation with Height
In order to proceed with the calculations according to (3) formula, we need to find out how the power varies with altitude, during cruise flight. In this formula PCR/PTOis used, it is the relative ammount of engine shaft power left at altitude and at a certain aircraft speed. There are several formula to calculate it, the most used for a turboprop are these:
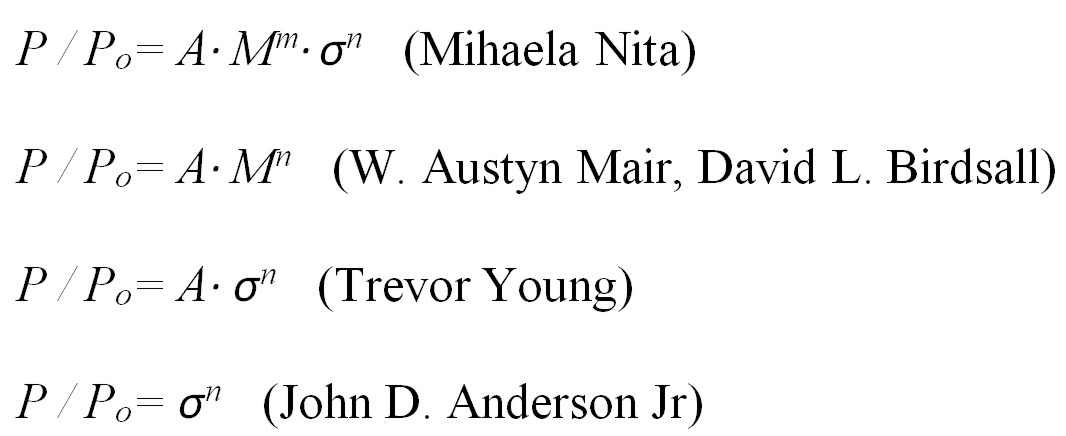
A, n and m to calculate the relative ammount of engine shaft power PCR/PTO as function of altitude (by σ) and Match number M.
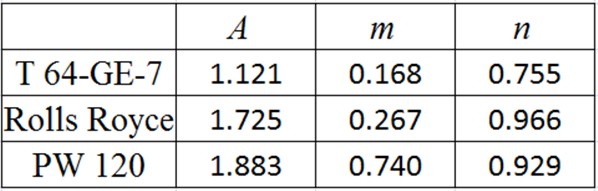 Table 3: Tipical values for A, m and n.
For the turboprop is used generically P / Po= A·σn. A turboprop is a gas turbine driving a propeller. This gives a relatively high weight per unit of cruise thrust, caused by the weight of the propeller and especially of the reduction gear. However, when comparing to a turbofan, for example, the disadvantage of low cruise speed and low thrust to weight ratio must be balanced against the advantage of good fuel economy. The propulsive efficiency for a turboprop remains nearly constant during cruise. Also its performance is much superior to that of a turbojet or turbofan engine during take-off and climb. An aspect concerning costs is also an advantage, because the maintenance cost is much less and the turboprop engine is more reliable. The term σ provides the corresponding variation of the power with height, it is the parameter which influences directly the combustion. The n coefficient comes from the engine data from the manufacturer, and it may vary differently from one engine to another.
5-4) Wing Loading
Since the Lift is equal to L=1/2 ρ v² S CL (L is lift force, ρ is air density, v is true airspeed, S is planform area, and CL is the lift coefficient at the desired angle of attack, Mach number, and Reynolds number), when applying the equation lift equal to weight (mMTO · g), we can obtain the analytic expression of the wing loading:
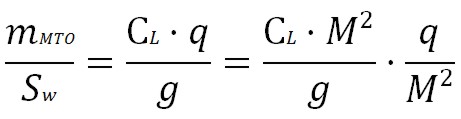
For conservative reason we use mMTO that is bigger than the cruise mass (for the fuel consumption). For the CL coefficient we can use the formula (4) considering tha assumption that the aircraft is flying with minimum drag or maximum lift to drag ratio. The speed of sound varies with pressure and density, as we know from thermodynamics:
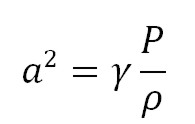
γ is the Adiabatic index or ratio of specific heats equal to cp / cv, and since:
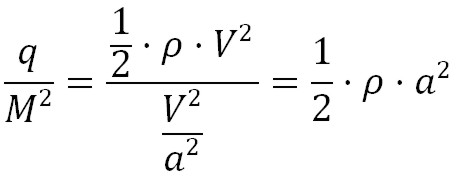
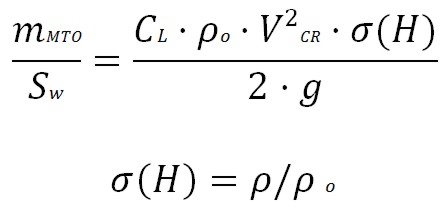
We have now the final formula for the wing loading, as follows:
![]()
![]()
Considering the instead of Mach number, the cruise speed the wing loading becames ( is the density
ratio):
The results depends on the height and can be represented into the Matching Chart.
6) Maximum Take-off Mass
An estimation for maximum take-off mass is also required. This mass represents the sum of operating empty mass, payload and fuel mass:
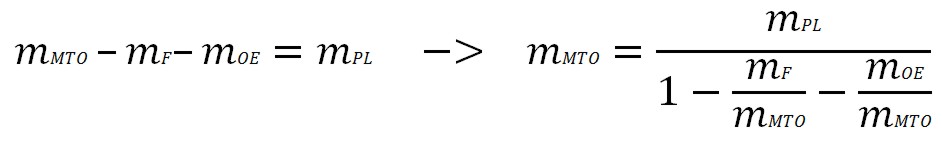
The relative fuel mass and operating empty mass are design parameters. The relative fuel mass needs an estimation for obtaining the maximum take-off mass. The fuel is used during all flight phases, including taxiing, as shown below.
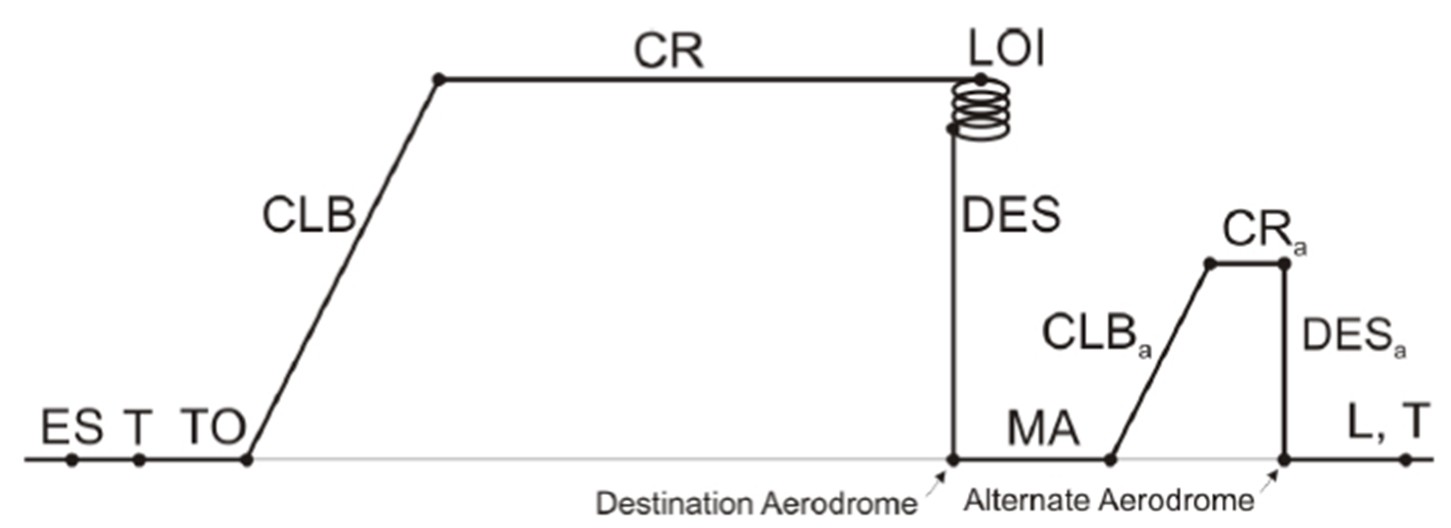
Figure 13: Typical flight phases of a flight mission
In every flight phase can be defined a mass fraction, the mission fuel fraction Mff helps the calculating of the fuel consumption for the entire flight.
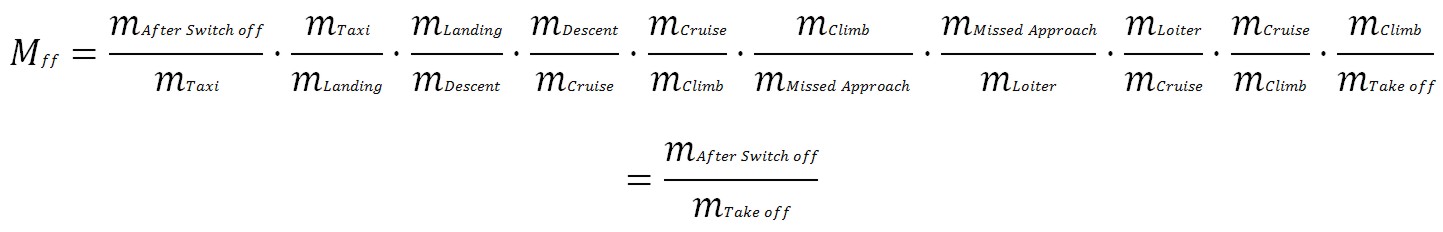
Thus the fuel mass consumed during the flight is equal to:

Mff depends of the mission, and comes from the statistics. For cruise and loiter we have to first determine the Breguet range factor, for a propeller driven aircraft it is equal to:
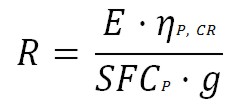
SFCP refers to the performance-specific fuel consumption and, ηP is the propeller efficiency. It is used to calculate the segment fuel fraction for the cruise flight phase:
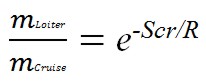
Scr is the distance flown in cruise.
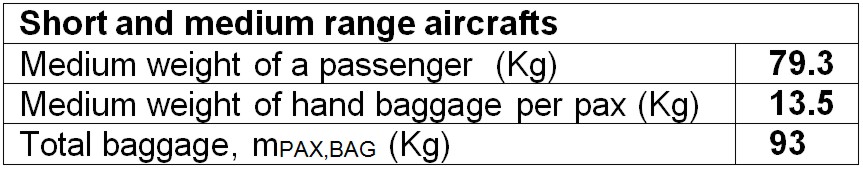
– Payload
The payload is the sum of the weight of passenger and the weight of their baggage (hand baggage and cargo baggage):
![]()
The weight of a passenger, according to statistics, for short and medium range aircrafts is shown in the following Table:
Matching Chart
The matching chart helps to graphically solve a two-dimensional optimization problem the final. The flight mechanic calculations for propellers are based on power P, whereas calculations for jets are based on thrust T. The two dimensions represented in the matching chart are power to weight ratio and wing loading. When choosing the design point we have to consider achieving the smallest possible thrust to weight ratio (respectively power to mass) at the highest possible wing loading. The ideal case is when all the lines come together.