In aerodynamics, the flight envelope defines operational limits for an aerial platform with respect to maximum speed and load factor given a particular atmospheric density. The flight envelope is the region within which an aircraft can operate safely. The V-g diagram leads you to cornering speed and that allows you to extract maximum performance from your aircraft without breaking it.
If an aircraft flies ‘outside the envelope’ it may suffer damage; the limits should therefore never be exceeded. The term has also been adopted in other fields of engineering when referring to the behaviour of a system which is operating beyond its normal design specification, i.e. ‘outside the flight envelope’ (even if the system is not even actually flying).
Visual Representation. There are several types of aircraft flight envelope diagram, normally depicting the relation between one flight parameter and another. The most common diagram includes airspeed (normally expressed in Mach) and flight altitude variation (V-h) or airspeed and load variation (V-n).
This second diagram is the most important and common plot used as it shows structural load limits as a function of airspeed. This flight envelope is normally defined during the design phase. A chart of speed versus load factor (or V-n diagram) is a way of showing the limits of an aircraft’s performance. It shows how much load factor can be safely achieved at different airspeeds.
The definition and analysis of the V-n diagram is critical during the design of an aircraft as it affects the operation of the aircraft. A manoeuvre or gust of wind may temporarily force an aircraft outside its safe flight envelope and thereby cause structural damage endangering flight safety.
V-n FLIGHT ENVELOPE
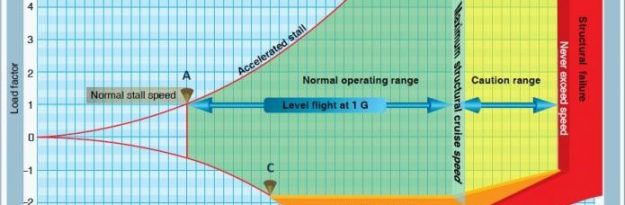
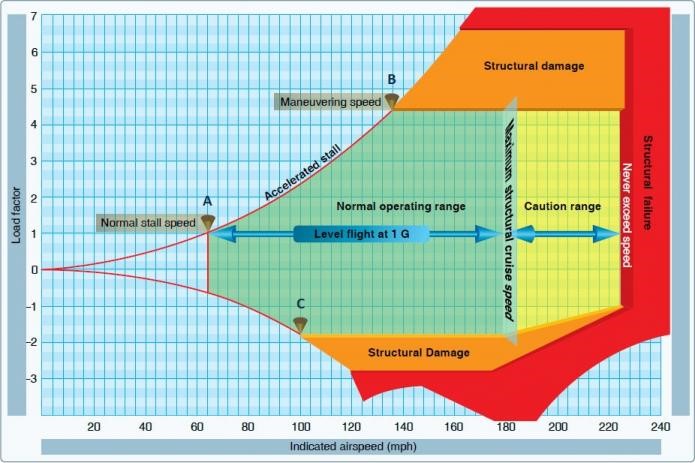
The following is a basic V-n diagram (sometimes referred to as a V-g diagram) including the most important features of such diagrams. The diagram does not belong to a specific airplane. In this example the V-n diagram represents airspeed (horizontal axis) against load factor (vertical axis). In more complex aircraft the diagram may vary.
Typical V-n diagram
Load Factor. An aircraft structure is designed to be able to withstand the forces exerted upon it during flight; together, these forces are calculated as the load factor and may vary depending on the phase of flight; the load factor is defined as the relationship between lift and the weight of the aircraft:
 where
where
n = Load factor
L = Lift
W = Weight
The load factor is equal to 1 when the aircraft is static on the ground, with only gravity acting upon it. The load factor can therefore be defined as a multiple of gravitational acceleration g.
There are various important features of the V-n diagram:
– The normal stall speed (point A) is defined by the aerodynamic characteristics of the platform. In the example above the aircraft is capable of developing n=1 (1g) at 62 mph, which is the wing level stall speed of the aircraft.
– The intersection of the positive limit of the load factor and the line of maximum lift (point B) defines the maximum airspeed that allows full manoeuverability. This point is called the manoeuver speed or corner speed. At lower speeds, the structure cannot be overstressed as it will stall before reaching the limit load factor. At the manoeuver airspeed the aircraft’s limit load factor will be reached at the lowest possible airspeed. At higher speeds, possible structural damage may be caused. In the diagram above, the manoeuvering speed is reached in n=4.4g and IAS=137 mph.
– The intersection of the negative limit load factor and line of maximum negative lift capability (point C) defines the maximum airspeed that allows full manoeuverability in a negative lift situation. As the graph shows, airspeeds greater than point C provide sufficient negative lift to damage the structure.
– The airspeed necessary to produce a given negative load factor is higher than that to produce the same positive load factor.
– To ensure structural safety, a maximum structural cruise speed should be defined. It is normally defined as a reference point for every aircraft; in the example above it is 180mph. Additionally, the diagram defines the never exceed speed or diving speed. This is the maximum speed (normally 1.25 Cruise speed) before the aircraft enters the region where structural failure is possible
– When an aircraft is operated in the regions called Structural Damage or Structural Failure, unacceptable permanent deformation of the primary structure and a high rate of fatigue may take place. Operation above the limit load factor must therefore be avoided in normal operation.
[smartslider3 slider=”2″]